Time Remapping Using the Keyframe Graph
While the Time Remap tool allows you to make speed adjustments to clips quickly,
you can also make time remapping changes using the keyframe graph in either the
keyframe editor of the Timeline or the keyframe graph area of the Motion tab in the
Viewer. In particular, editing the keyframe graph is the only way to modify keyframe
velocity, easing the transition from one keyframe to another using smoothed
keyframes with Bezier handles.
The following illustrations show how changes to the keyframe graph affect the speed
of a clip in the Timeline. In each graph, the vertical axis represents media time, where
each tick mark up is a successive frame of your video clip. The horizontal axis represents
the Timeline, where each tick mark represents the duration of one frame playing at the
sequence frame rate.
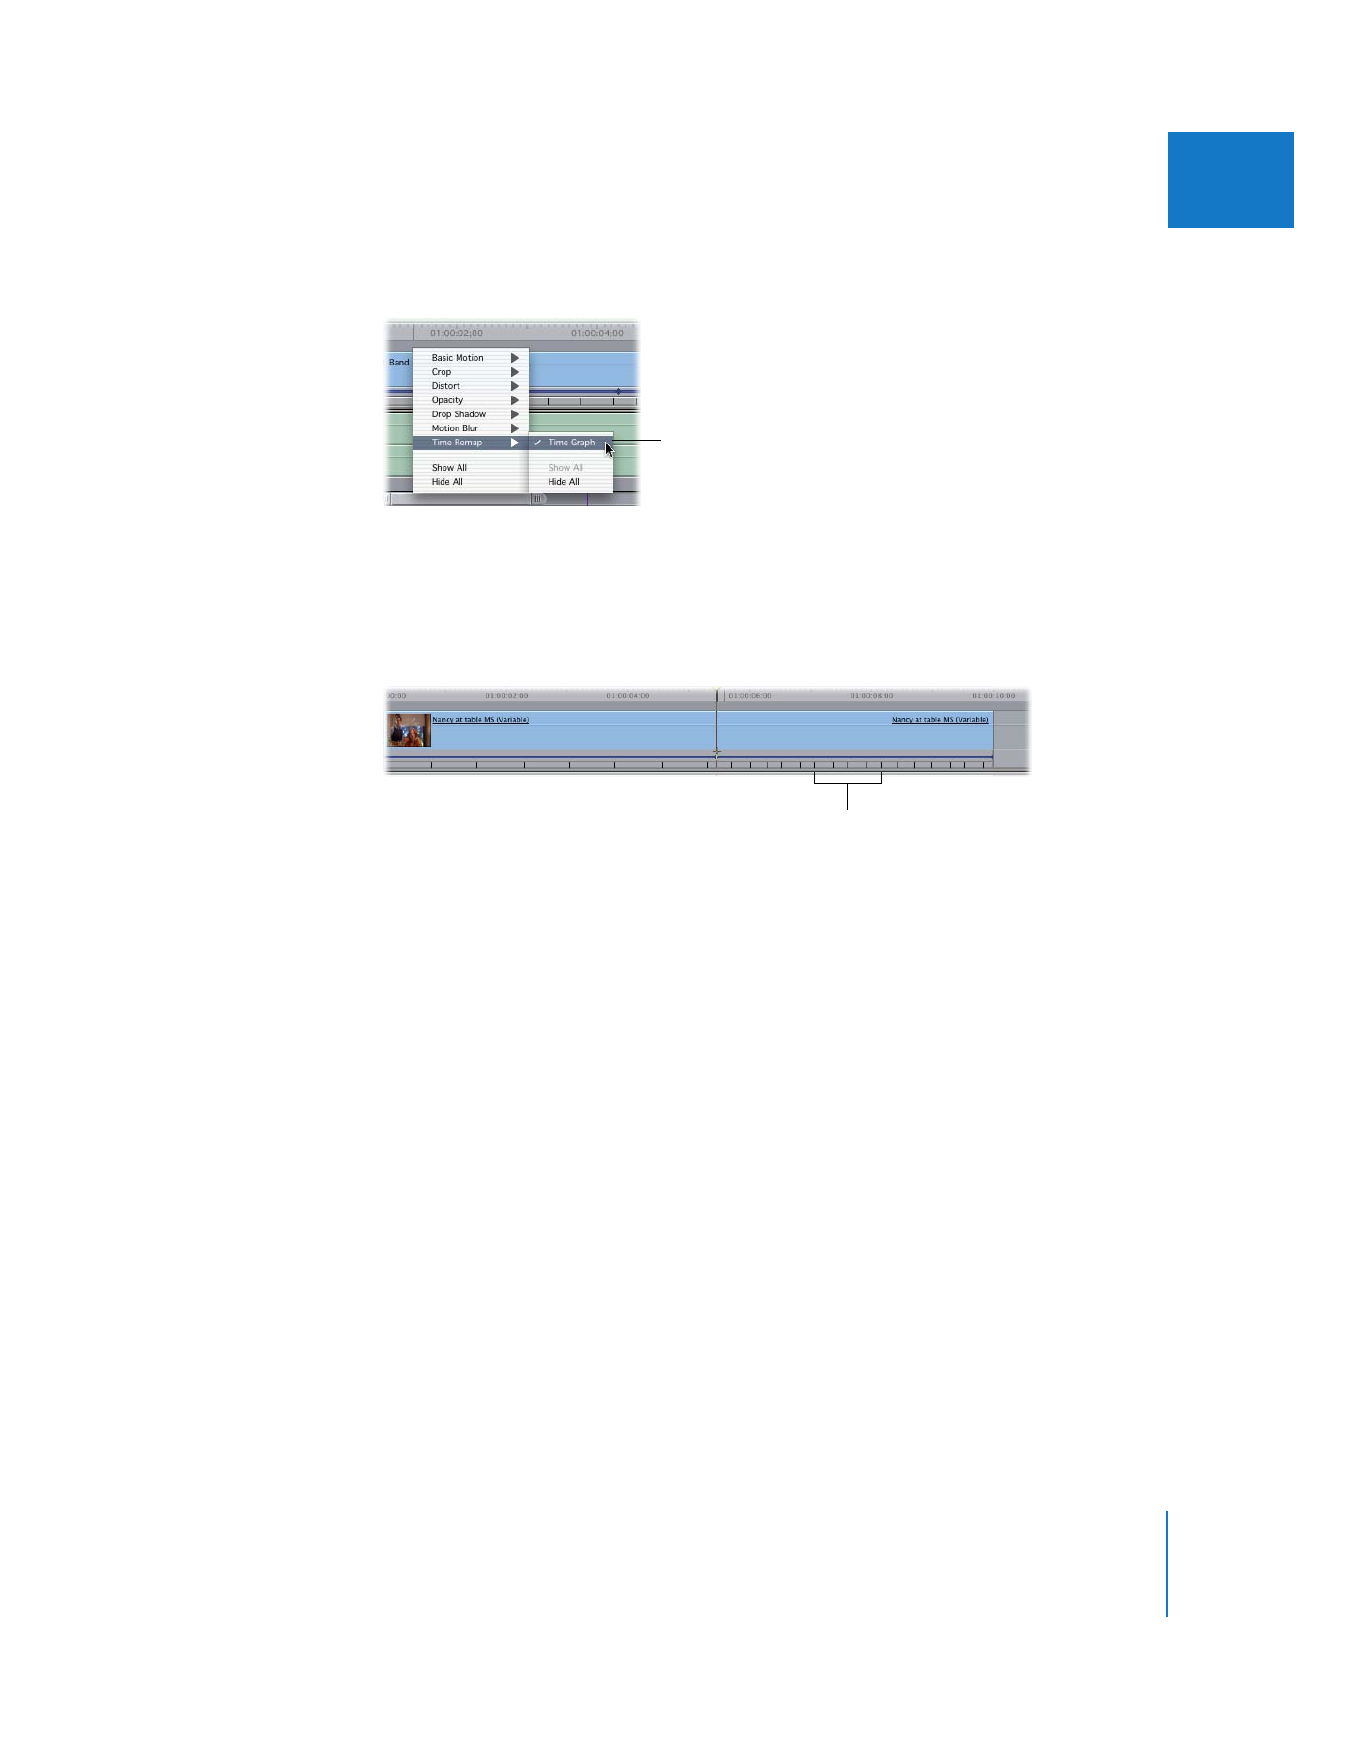
Click here to make the
time remapping
keyframes visible.
Speed indicators

360
Part II
Effects
 Linear time (100 percent speed): This is represented by a straight, upward-sloping
diagonal line, in which one frame of a video clip plays in the space of one frame of
the Timeline. This is real time.
 Slow motion (less than 100 percent speed): Slow motion is represented by a line with a
more gradual slope, in which one frame of a video clip may play over perhaps three
frames of the Timeline.
 Fast-forward (greater than 100 percent speed): Fast-forward speed can be seen as a
steeper line, in which several frames of a video clip play in the space of one frame of
the Timeline.
Sequence time
Linear time
Sour
ce time
Sequence time
Slo
w motion
Sour
ce time
Sequence time
Fast-f
or
w
a
rd
S
our
ce time

Chapter 17
Changing Clip Speed and Time Remapping
361
II
 Freeze frame (0 percent speed): So far, all these graphs have illustrated forward-playing
clips, represented by a line that slopes upward. A freeze frame, represented by a flat
line, may also be created with the keyframe graph.
 Reverse speed (less than 0 percent speed, or negative speed): When a clip plays in
reverse, previous frames of the video clip are mapped to successive frames of the
Timeline. Reverse speed is represented by a line that slopes downward.
 Acceleration/deceleration: Finally, the most powerful feature of the keyframe graph is
the ability to adjust the transition in a clip from one speed to another, at whatever
velocity you require. Gradual changes from one speed to another are represented by
curves. For example, a gradual transition from slow motion to fast-forward might
look like this:
Sequence time
Freeze frame
Sour
ce time
Sequence time
Re
verse s
peed
Sour
ce time
Sequence time
Acc
eler
ation
Sour
ce time

362
Part II
Effects
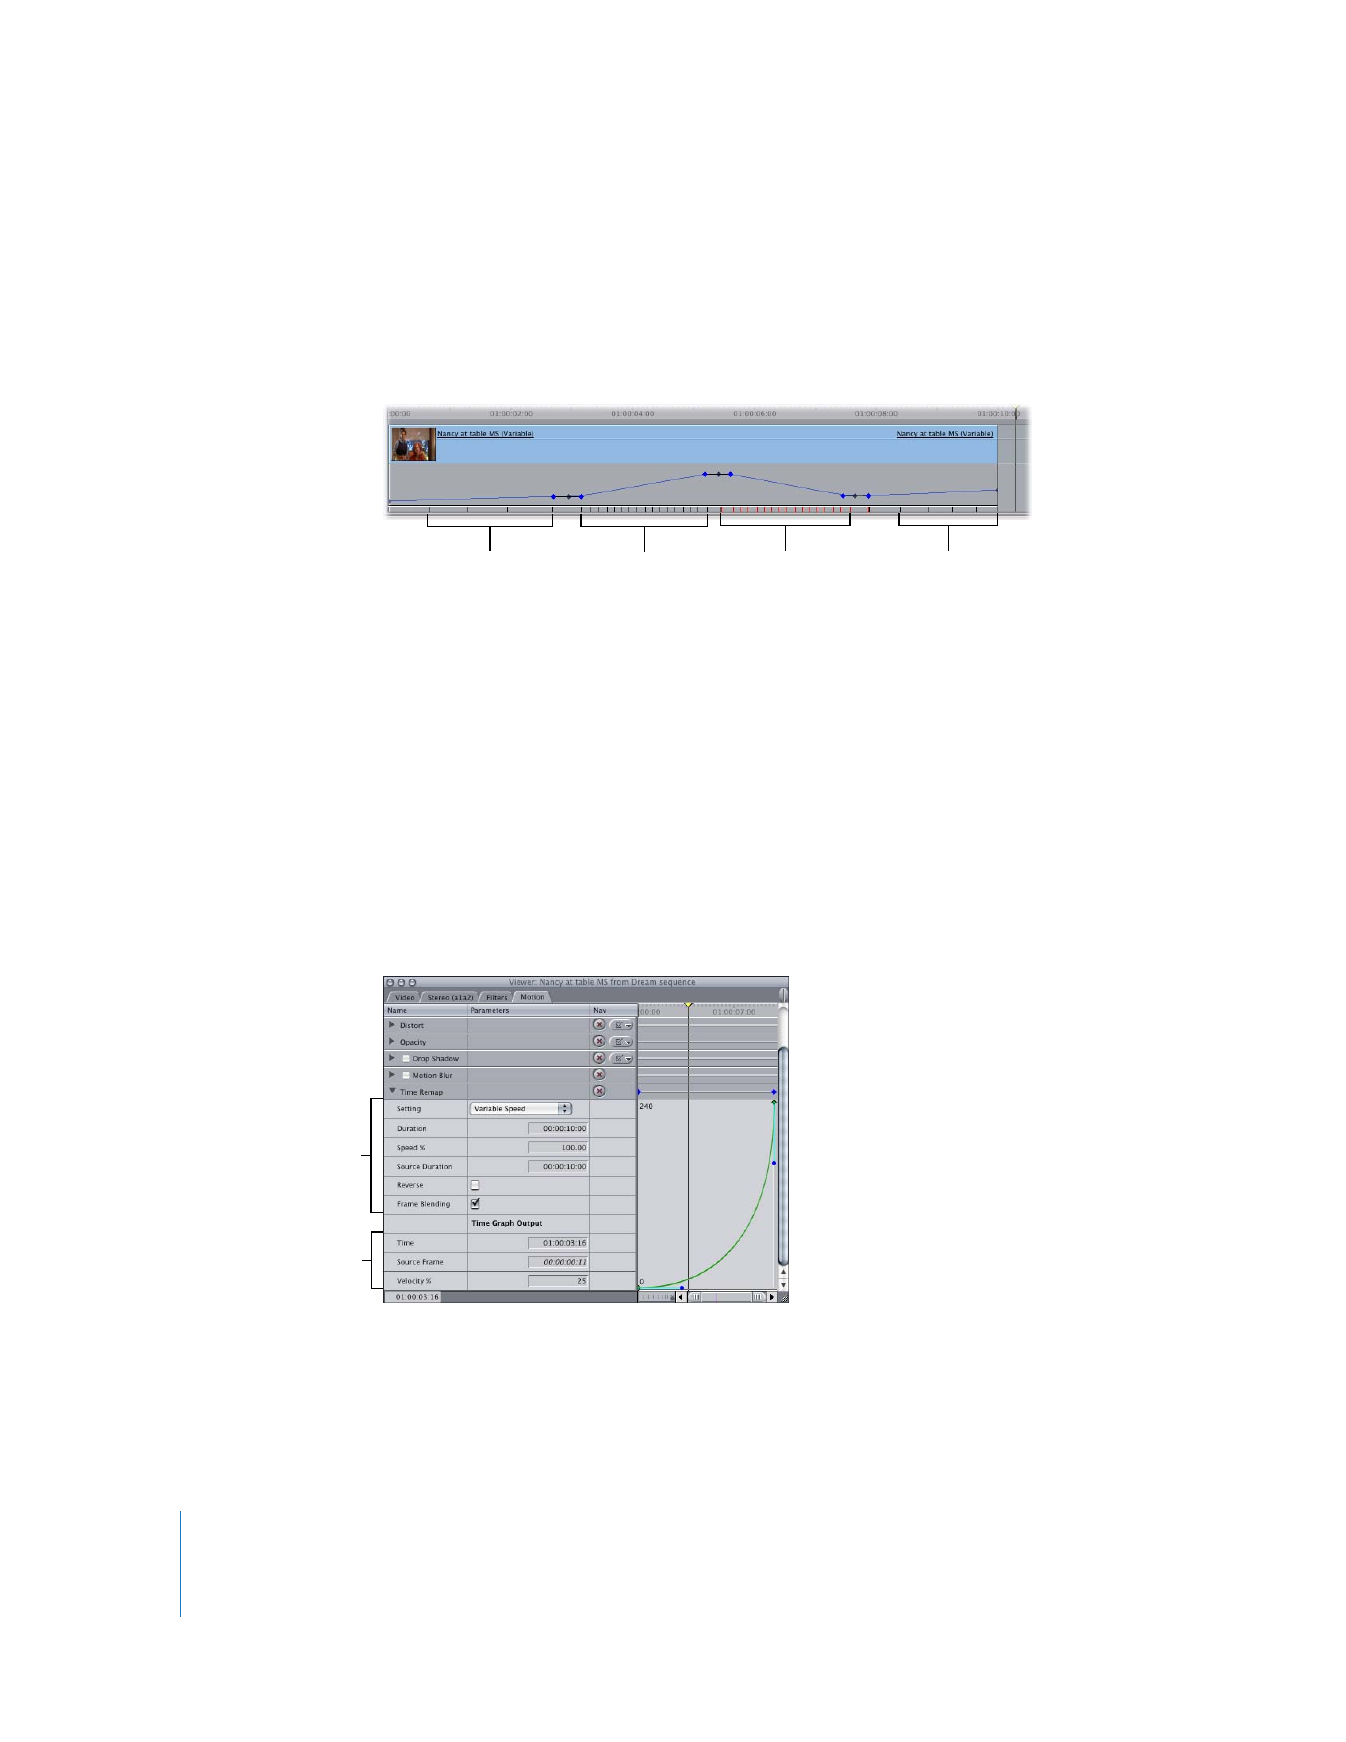
When you put all this together, you can start to understand what is happening in more
complex time remapping keyframe graphs. For example, in the following graph, you
can see that the clip begins by playing in slow forward motion, gradually speeds up,
and then goes in reverse briefly before going back into slow forward motion just
before the end of the clip. Each speed transition is smoothed out by a Bezier keyframe.
For more information on using Bezier handles to smooth keyframes, see “
Smoothing
Keyframes
” on page 310. For more information on working in the keyframe editor of the
Timeline, see “
Working with the Timeline Keyframe Editor
” on page 325.
∏
Tip: The keyframe editor area of the Timeline can be resized vertically, allowing you to
have a more detailed view of the keyframe graph you’re editing. For more information,
see “
Working with the Timeline Keyframe Editor
” on page 325.